Animations of the Catalogue
We show now the size of the stability regions, by an animation of the stability-maps.
The grid of the stability-maps are 0.9 < a < 1.1 with Δa = 0.0025 and 0° < λ <
180° with Δλ = 1° (λ=synodic longitude of the fictitious Trojan planet and
a the semimajor axis). We checked the stability by using the Lyapunov characteristic Indicator (LCI) which
is shown on a logarthmic scale. The computations were done for 10000 periods.
Light blue regions represent escaping orbits, dark ones stable orbits (see Figures below).
Access to the Animations
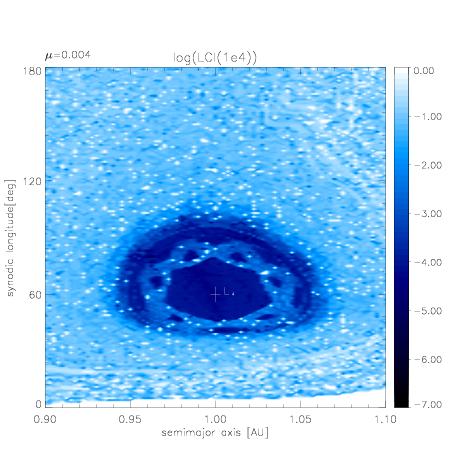
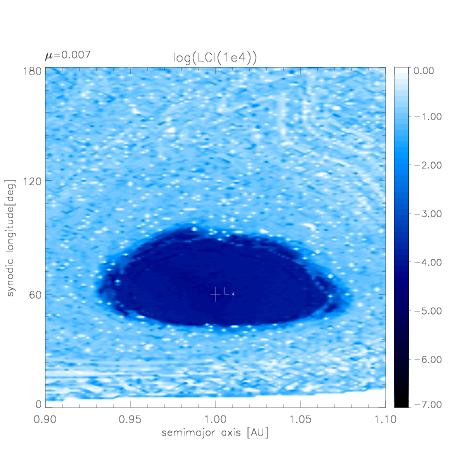
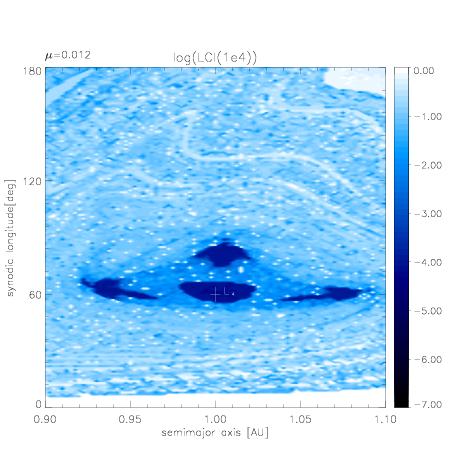
Examples for an initial eccentricity of 0 and μ=0.004 (left figure), μ=0.007 (middle figure),
μ=0.012 (right figure)
|